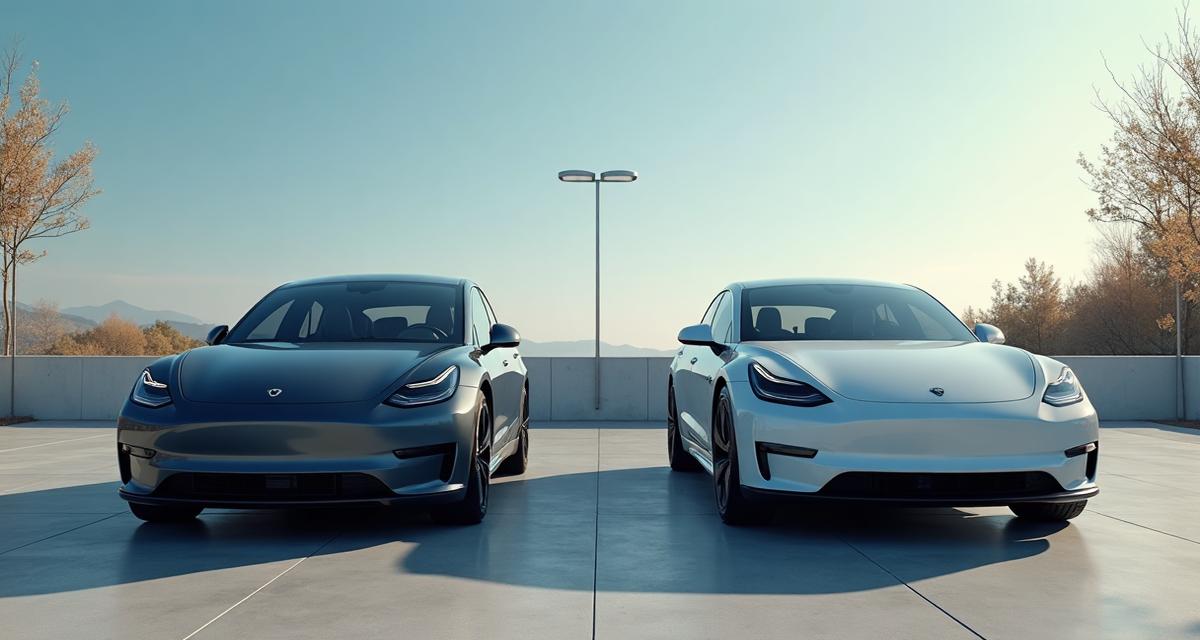
EV vs Petrol: Quick Cost Summary
Electric vehicles have higher purchase prices but significantly lower running costs:
| Cost Category | Electric Car | Petrol Car | EV Advantage |
|---|---|---|---|
| Purchase price | +€5-15k higher | Lower | Petrol wins |
| Fuel/Energy (per 100 km) | €3-5 | €10-15 | EV 60-70% cheaper |
| Maintenance (annual) | €200-400 | €500-1,000 | EV 50-60% cheaper |
| Insurance | Similar or +10% | Baseline | Varies |
| Road tax | Often €0 or reduced | €100-500 | EV wins |
| Depreciation | Higher initially | More stable | Varies |
Fuel vs Electricity Cost Comparison
The biggest savings come from energy costs:
Cost per 100 km Calculation
EV vs Petrol Energy Comparison
Compare energy costs between EV and petrol vehicles. An efficient EV uses about 17 kWh/100km, while a petrol car uses about 7 L/100km. At €0.25/kWh and €1.80/L: EV cost = 17 × 0.25 = €4.25/100km. Petrol cost = 7 × 1.80 = €12.60/100km. The EV saves 66% on fuel costs.
Try the Calculator
Use our free Miles to Kilometers converter for instant, accurate results.
📏Convert mi → kmAnnual Fuel/Energy Costs
For 15,000 km per year:
| Vehicle Type | Consumption | Annual Cost | vs. Avg Petrol |
|---|---|---|---|
| Petrol (7 L/100km) | 1,050 L | €1,890 | Baseline |
| Petrol (9 L/100km) | 1,350 L | €2,430 | +29% |
| Diesel (6 L/100km) | 900 L | €1,530 | -19% |
| Hybrid (4 L/100km) | 600 L | €1,080 | -43% |
| EV - Home charging | 2,550 kWh | €510 | -73% |
| EV - Public charging | 2,550 kWh | €1,020 | -46% |
| EV - Mixed charging | 2,550 kWh | €680 | -64% |
Understanding EV Charging Costs
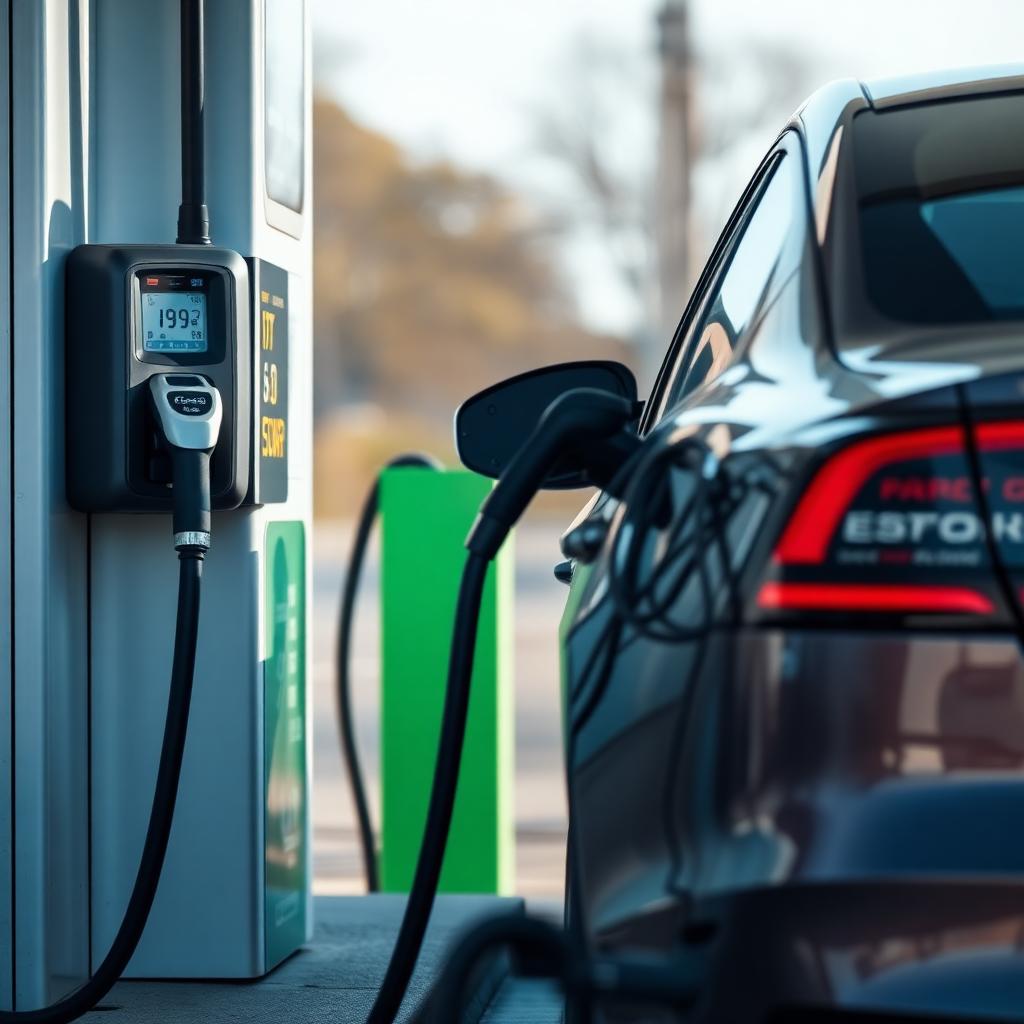
Where you charge dramatically affects EV running costs:
| Charging Type | Cost per kWh | Cost per 100 km* | Notes |
|---|---|---|---|
| Home (off-peak) | €0.10-0.15 | €1.70-2.55 | Cheapest option |
| Home (standard) | €0.20-0.35 | €3.40-5.95 | Most common |
| Workplace (free) | €0.00 | €0.00 | Great if available |
| Public AC | €0.35-0.50 | €5.95-8.50 | Destination charging |
| DC Fast (branded) | €0.45-0.60 | €7.65-10.20 | Tesla, Ionity, etc. |
| DC Fast (premium) | €0.70-0.90 | €11.90-15.30 | Highway premium |
Maintenance Cost Comparison
EVs have significantly lower maintenance costs due to simpler mechanics:
Why EV Maintenance Is Cheaper
Annual Maintenance Costs
Typical annual maintenance for 15,000 km:
| Service | Petrol Car | Electric Car | EV Savings |
|---|---|---|---|
| Oil change | €150-250 | €0 | €150-250 |
| Air filter | €30-50 | €30-50 | €0 |
| Brake pads (amortized) | €100-150 | €40-60 | €60-90 |
| Spark plugs (amortized) | €50-80 | €0 | €50-80 |
| Transmission service | €50-100 | €0 | €50-100 |
| Other services | €100-200 | €100-150 | €0-50 |
| **Total annual** | **€480-830** | **€170-260** | **€310-570** |
Total Cost of Ownership (5 Years)
Complete 5-year comparison for a mid-size vehicle (15,000 km/year):
| Cost | Petrol Car | Electric Car | Difference |
|---|---|---|---|
| Purchase price | €35,000 | €45,000 | +€10,000 |
| Government incentive | €0 | -€5,000 | -€5,000 |
| Fuel/Electricity | €9,450 | €3,400 | -€6,050 |
| Maintenance | €3,500 | €1,200 | -€2,300 |
| Insurance (5 yrs) | €4,000 | €4,400 | +€400 |
| Road tax (5 yrs) | €1,000 | €0 | -€1,000 |
| Depreciation | €14,000 | €18,000 | +€4,000 |
| **Total 5-year cost** | **€66,950** | **€67,000** | **≈ Equal** |
When Does an EV Break Even?
The breakeven point depends on your driving and charging patterns:
Breakeven Calculation
Environmental Cost Comparison
Beyond financial costs, EVs have significant environmental advantages:
| Impact | Petrol Car | Electric Car | EV Advantage |
|---|---|---|---|
| CO₂ per 100 km (driving) | 16.1 kg | 7.1 kg* | 56% less |
| Annual CO₂ (15,000 km) | 2,415 kg | 1,065 kg | 1,350 kg saved |
| Lifetime CO₂ (200,000 km) | 32.2 tonnes | 14.2 tonnes | 18 tonnes saved |
| Local air pollution | High (NOx, PM) | Zero | 100% reduction |
| Noise pollution | Moderate | Very low | Much quieter |
Who Should Buy an EV?
EVs make the most financial sense if you:
✅ **Drive 15,000+ km per year** - Higher mileage = faster savings ✅ **Can charge at home** - Home charging is 50-70% cheaper than public ✅ **Have access to incentives** - Tax credits, purchase grants reduce upfront cost ✅ **Keep cars 5+ years** - Longer ownership = more savings ✅ **Do mostly urban/suburban driving** - EVs excel in stop-and-go traffic
EVs may not be ideal if you: ❌ Drive very low annual mileage (<8,000 km) ❌ Cannot charge at home or work ❌ Frequently drive very long distances without charging infrastructure ❌ Plan to sell the car within 2-3 years
❓Frequently Asked Questions
Related energy tools & guides
Part of the Electric Vehicles hub — explore the connected calculators, guides and topics.
Free calculator — Electric Vehicles
EV Charging Cost Calculator
Cost per session, per 100 km, per year — plus savings vs petrol and CO₂ avoided, with editable home/public tariff split.
Open calculator