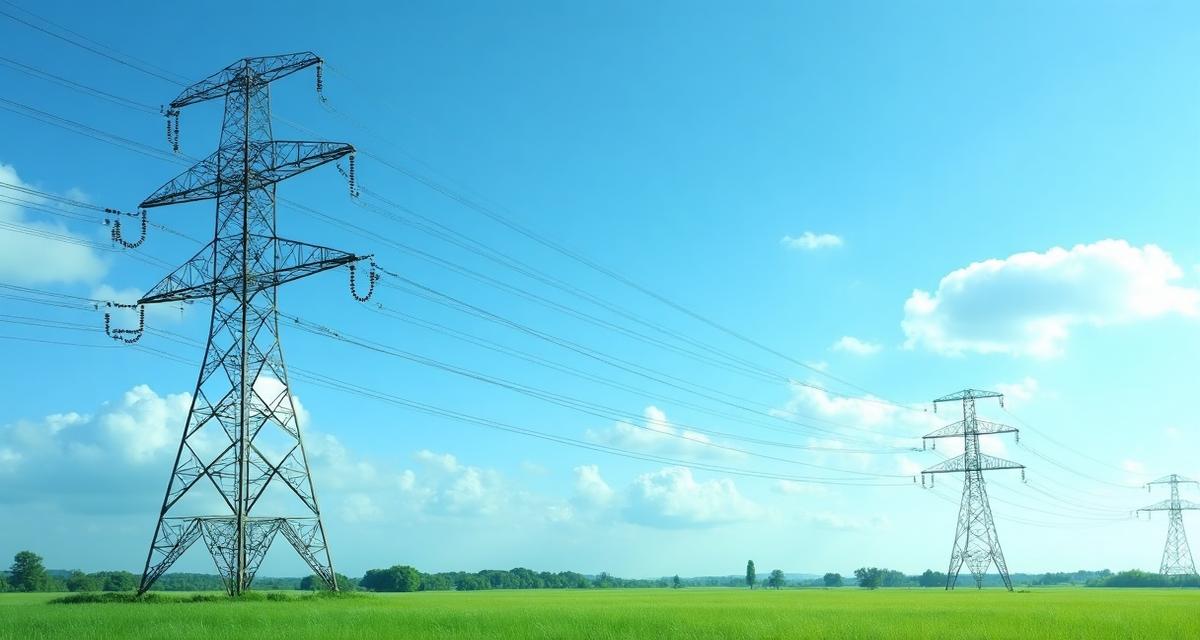
How Electricity Generates CO₂
Electricity itself does not produce CO₂—the power plants generating it do. Different energy sources have vastly different emission profiles:
- Coal: Highest emissions, 820-1,200 g CO₂/kWh
- Natural gas: Medium emissions, 350-500 g CO₂/kWh
- Solar/Wind/Hydro: Near zero operational emissions (5-50 g CO₂/kWh lifecycle)
- Nuclear: Very low emissions, 5-20 g CO₂/kWh lifecycle
How to Calculate Your Electricity CO₂
The formula is simple—multiply your consumption by your grid carbon intensity:
Electricity CO₂ Formula
World Average Electricity CO₂ Calculation
Calculate emissions using world average grid intensity of 475g CO₂/kWh. Formula: CO₂ (kg) = kWh × 0.475. For example, 1,000 kWh = 1,000 × 0.475 = 475 kg CO₂. A typical household using 4,000 kWh/year produces about 1,900 kg of CO₂ from electricity alone.
Try the Calculator
Use our free Kilograms to Pounds converter for instant, accurate results.
⚖️Convert kg → lbGrid Carbon Intensity by Country
Carbon intensity varies enormously based on each country electricity mix:
| Country | g CO₂/kWh | Main Sources | 10,000 kWh = |
|---|---|---|---|
| Iceland | 15 | 100% renewable (geothermal/hydro) | 150 kg |
| Norway | 19 | 98% hydro | 190 kg |
| Sweden | 45 | Hydro + nuclear | 450 kg |
| France | 85 | 70% nuclear | 850 kg |
| Canada | 130 | Hydro + gas | 1,300 kg |
| UK | 250 | Gas + wind + nuclear | 2,500 kg |
| Spain | 200 | Mixed renewables + gas | 2,000 kg |
| Germany | 380 | Coal + renewables + gas | 3,800 kg |
| USA (average) | 420 | Gas + coal + nuclear | 4,200 kg |
| Japan | 450 | Gas + coal + nuclear | 4,500 kg |
| China | 550 | Coal dominant | 5,500 kg |
| Australia | 650 | Coal + gas | 6,500 kg |
| Poland | 770 | Coal dominant | 7,700 kg |
| South Africa | 900 | Coal dominant | 9,000 kg |
Norway Electricity CO₂ Calculation
Calculate emissions with clean Norwegian hydropower at just 19g CO₂/kWh. Formula: CO₂ (kg) = kWh × 0.019. Even 10,000 kWh in Norway produces only 190 kg CO₂—25 times less than the world average. This is why EVs charged in Norway have an extremely low carbon footprint.
How Time of Day Affects Grid Emissions
Grid carbon intensity changes throughout the day as different power plants come online:
When Is Electricity Cleanest?
CO₂ Emissions of Common Appliances
Understanding which appliances contribute most to your electricity emissions:
| Appliance | Annual kWh | kg CO₂ (World avg) | kg CO₂ (Norway) |
|---|---|---|---|
| Electric car (12,000 km) | 2,500 | 1,188 | 48 |
| Heat pump (heating) | 4,000 | 1,900 | 76 |
| Electric water heater | 2,500 | 1,188 | 48 |
| Air conditioning | 1,500 | 713 | 29 |
| Refrigerator | 400 | 190 | 8 |
| Washing machine | 200 | 95 | 4 |
| Dishwasher | 250 | 119 | 5 |
| TV (4 hrs/day) | 150 | 71 | 3 |
| LED lights (whole home) | 200 | 95 | 4 |
| Computer (8 hrs/day) | 300 | 143 | 6 |
| Smartphone charging | 4 | 2 | 0.1 |
How to Reduce Your Electricity Carbon Footprint
Strategies to cut your electricity-related emissions:
Top Ways to Reduce Electricity Emissions
The Impact of Renewable Electricity
Switching to renewable electricity is one of the most impactful personal climate actions:
Renewable Electricity Impact
Germany Electricity CO₂ Calculation
Calculate emissions with German grid mix at 380g CO₂/kWh. Formula: CO₂ (kg) = kWh × 0.38. A German household using 4,000 kWh/year produces about 1,520 kg CO₂. Germany is transitioning to renewables, targeting 80% renewable electricity by 2030.
How Grids Are Getting Cleaner
Global electricity is gradually decarbonizing:
- 2010: World average 520 g CO₂/kWh
- 2020: World average 475 g CO₂/kWh
- 2023: World average 455 g CO₂/kWh
- 2030 target: 250 g CO₂/kWh
- 2050 target: Near zero
Solar and wind costs have dropped 90% since 2010, accelerating the transition. Many countries plan 100% renewable grids by 2035-2050.
❓Frequently Asked Questions
Related energy tools & guides
Part of the Carbon Footprint hub — explore the connected calculators, guides and topics.
Free calculator — Carbon Footprint
Carbon Footprint Calculator
Full personal CO₂ audit across electricity, heating, driving, flights, diet and goods — with country-specific grid factors and a 1.5 °C pathway benchmark.
Open calculator